Azure Logs to a SIEM
Recently, I worked with a customer that wanted to wrangle their Azure log data to meet their audit requirements. Their Security Operations Center (SOC) was mature and had an established Security Incident and Event Management (SIEM) process. To achieve compliance, they requested that only security event data from Azure be streamed to their SIEM solution. In this post, I describe the process to identify, filter, and stream the log data out of Azure.
Azure Monitor is “a comprehensive solution for collecting, analyzing, and acting on telemetry”1 from within Azure (and on-premise environments). By default, the solution provides you access to the platform activity log which provides insight into the activity against an Azure subscription. However, the data is only retained for 90 days which does not adhere to most enterprise data retention standards.
Enter Log Analytics Workspaces (LAW).
At a high level, LAW “is an Azure resource and a container where [log] data is collected, aggregated, and serves as an administrative boundary.”2 for analysis of the data. Log retention is typically the first checkbox that’s marked as part of an audit requirement whether an organization has workloads on-premise or in the public cloud. The challenge is how to make the logs you have actionable. One of the immediate benefits of directing logs to LAW is that it’s query engine is built on top of Azure Data Explorer which is powered by the Kusto Query Language (KQL). In comparison to other query languages (e.g., SQL, GraphQL), Kusto uses a similar syntax pattern that has a low barrier to entry. For example, once you create a workspace and start sending log data to it (after a brief delay for log ingestion), you’ll have a list of tables in the left pane of your workspace as shown below.
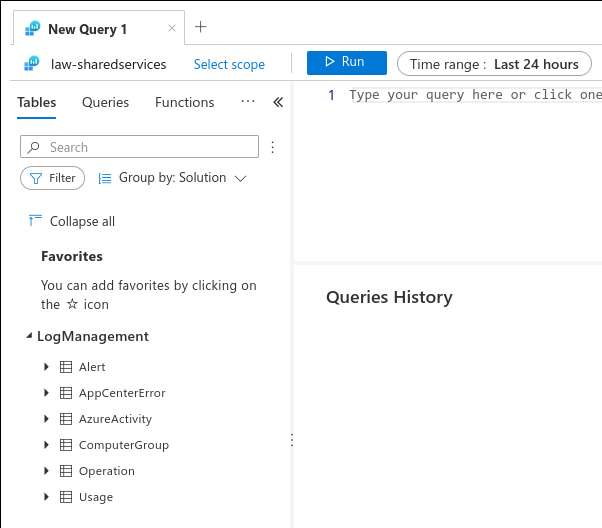
Once the tables are visible, stitching together a useful query is straight forward. You can double-click on the table name or start typing it in the query window.
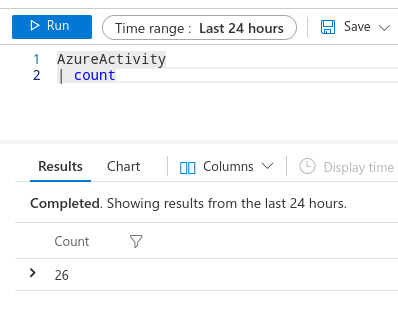
The above short query counts the number of rows in the AzureActivity with a timestamp less than or equal to 24 hours (as defined by the time range selector at the top of the query box). The extent and expanse of KQL is immense. If you’re interested, I highly recommend reviewing the KQL documentation in depth and practicing each of the skills listed in it.
My customer’s requirement was to only send security event data from Azure to their SIEM.
Right. With KQL, this was easy.
After setting up a couple of Windows VMs in my lab environment and configuring them with the Log Analytics Agent, I observed a new table in my LAW named Event and was able to filter on it with examples from the Azure documentation. In addition, I configured Azure Sentinel to receive Security Event data from the instructions in the documentation. Once these events were ingested, I observed the SecurityEvent table in the list of LAW tables. At this point, I knew I had the data I needed.
The next step of the solution was to build automation to poll the LAW with a predefined query to gather only the required events, and send them to Event Hub (where they would be polled by the SIEM).
Enter Logic Apps.
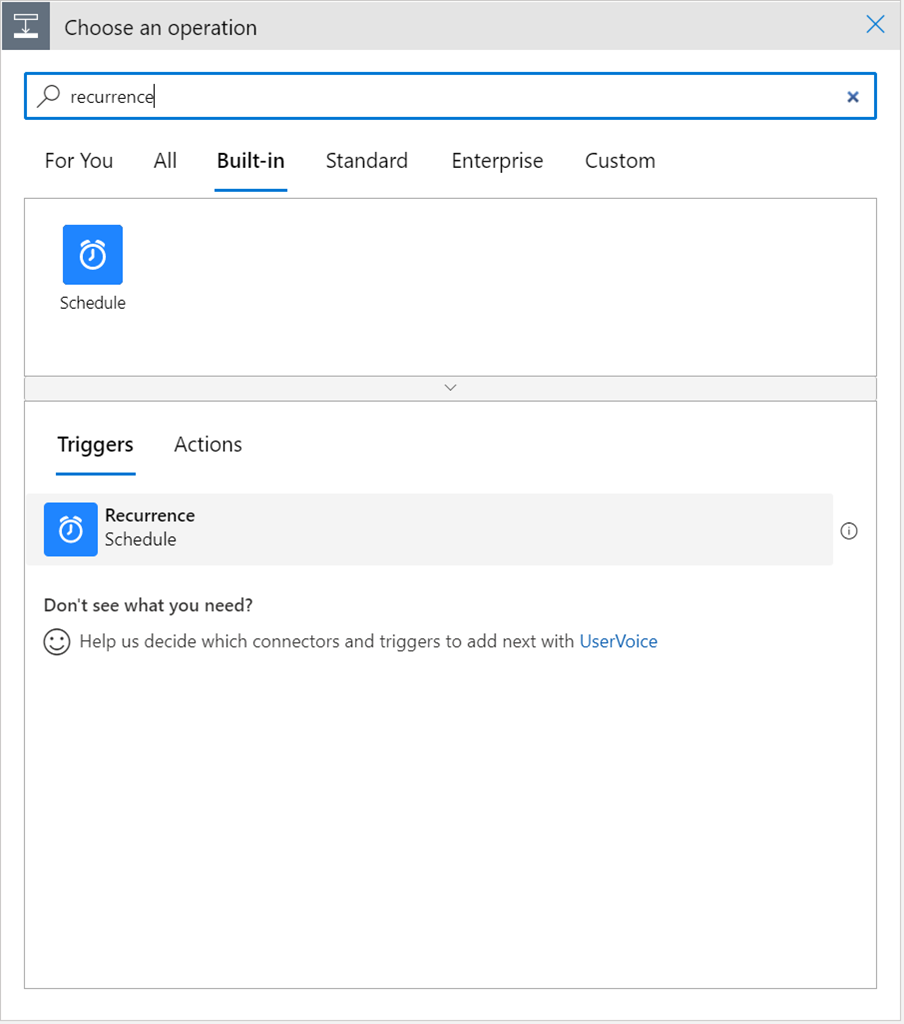
Logic Apps “is a cloud-based platform for creating and running automated workflows that integrate[s] apps, data, services, and systems.” Effectively, a low-code automation solution to perform exactly what my customer needs. I scanned the built-in connectors and found one called Schedule that had a trigger called Recurrence.
Awesome. I had my polling mechanism. I created a logic app, and added the trigger.
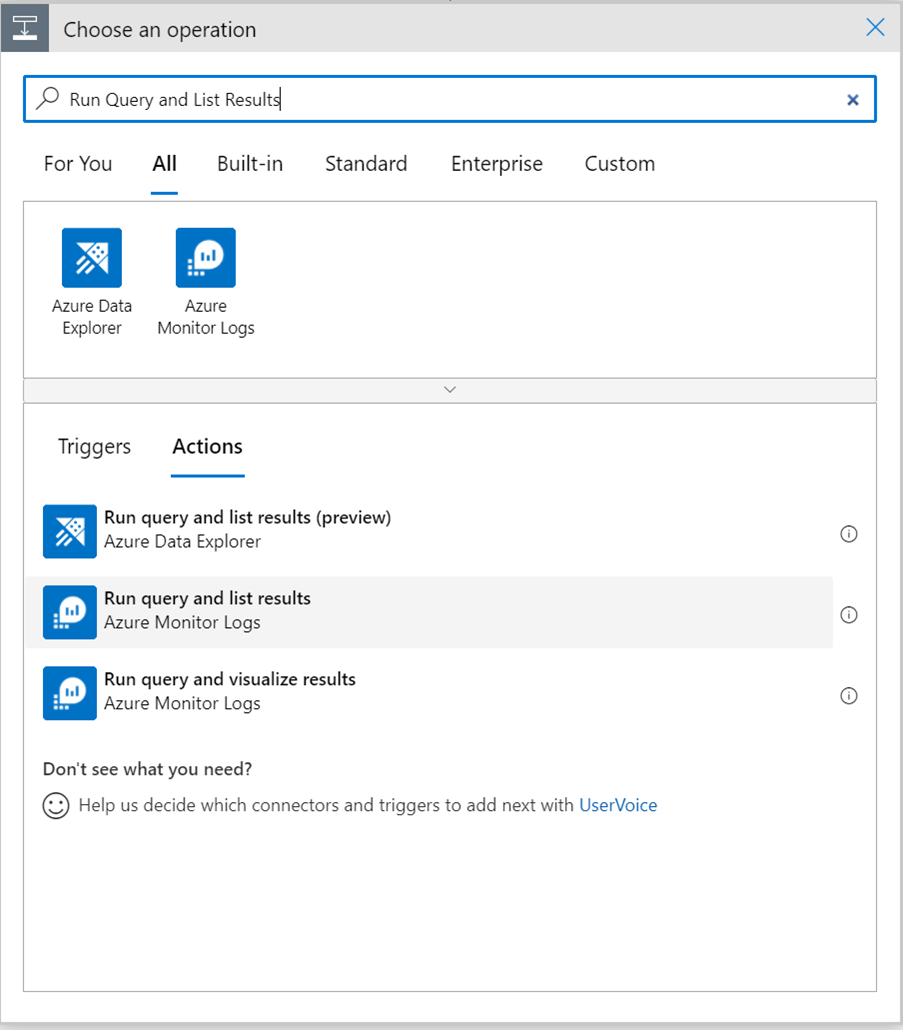
The next step was to pull data from my LAW… was there a connector for Azure Monitor?
Yes!
I added the connector, selected the Run query and list results trigger…
… and configured it using the query I had honed within my LAW.
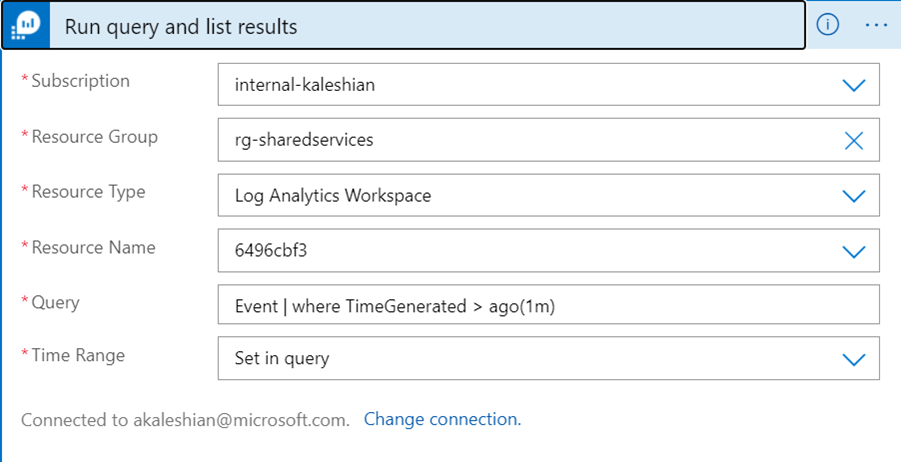
The only nuance was that the time window of the query had to match (or exceed) the interval frequency of the recurrence trigger to ensure that events wouldn’t be missed.
The next few steps required a bit of analysis (read: trial and error). The reason for the churn was because I didn’t quite understand how the records would be fed to my Logic App from the connector. I had assumed that it would be returned as a single blob that needed to be iterated on. I discovered that each row from the query required parsing and had to accommodate that step in my workflow. I discovered the For each action and configured it to take the value from the previous step and pass it to a step that would parse the JSON string.
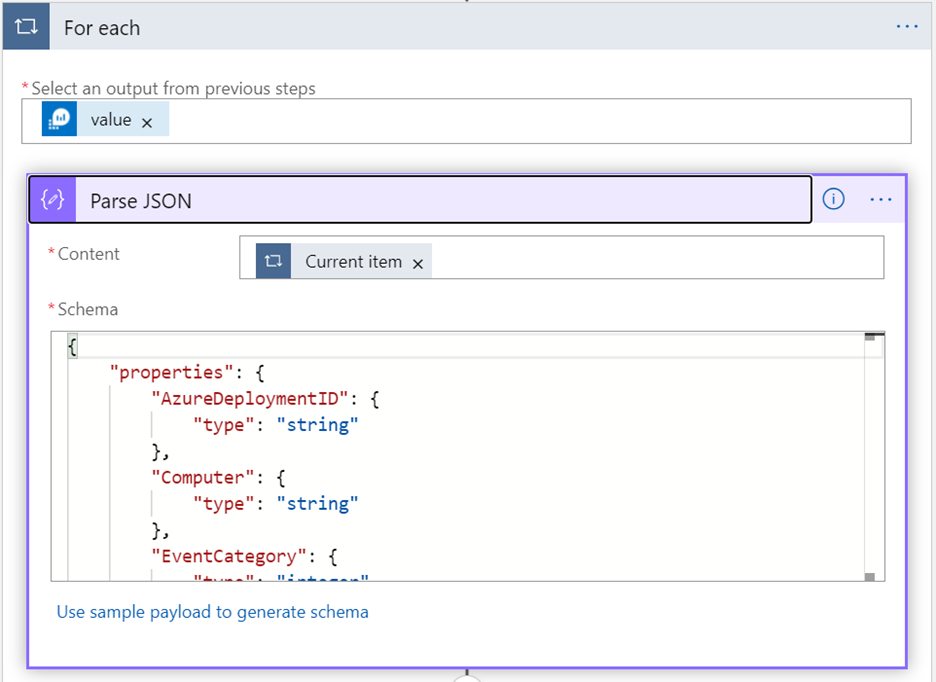
Configuring the Parse JSON action was… painful. For Parse JSON to be able to understand the incoming JSON object, it effectively needs to know the object structure, the keys, and what types the values will be (e.g., integer, string, etc.) The easy way is to follow the instruction in the action box and to “Use sample schema to generate schema” but we all know that a single example isn’t going to be comprehensive of the data.
I had to find another way.
I tried to export the schema of the source table from the LAW, but it didn’t produce an output that could be automated. I tried using the az cli, piping the output through jq, but that didn’t produce an output that could be directly transferred to the action. I was stuck, and frustrated, but was running out of time, so I conceded and massaged the most reasonable output from the above three options by hand, and produced the following two schemas:
At the publication time of this post, these two schemas were valid. I was able to create two separate logic apps with these two schemas, and appropriate adjustments to the log query (to respect the table of data that the schema was applicable to).
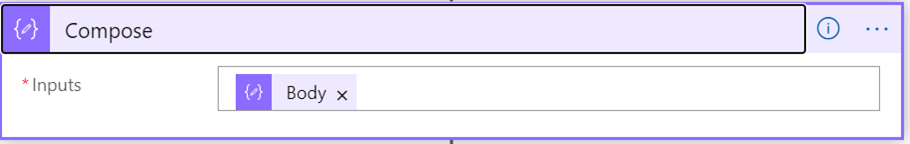
Once the Parse JSON action was configured, I discovered that I needed an additional step to aggregate the events into a single object before passing it to Event Hub. This action was the responsibility of the Compose action which only required a single argument of Body from the previous For Each.
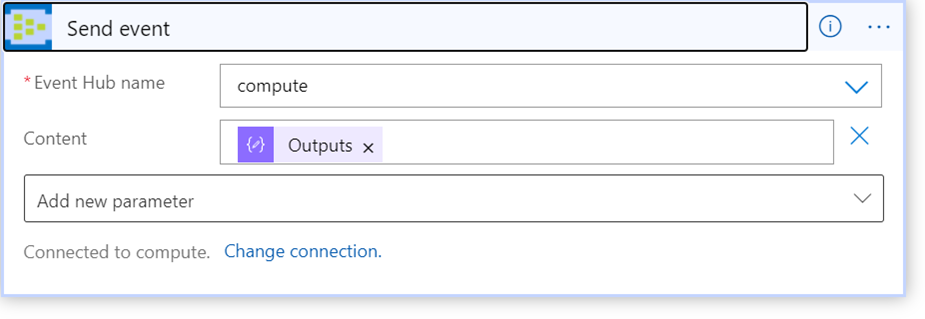
The last step was to send the completed message to Event Hub which required the Send event action in the Event Hubs category of connectors.
With the last step of the workflow configured, I was able to save the design and execute the workflow successfully. Through this process, I interacted with components of Azure that I would never expect (and was pleasantly surprised to). It reinforced my perspective that without a use case, it’s quite difficult to learn about how public cloud services can be configured (read: cobbled together) to achieve a desired outcome.
Happy solutioning!
Tweet to @kriation